Mapping the AI stack by what each layer discloses
Barakaeli Lawuo, Apr 1, 2026
In October 2023 a team from Stanford, MIT and Princeton published the first Foundation Model Transparency Index. They scored ten companies against 100 yes-or-no questions about their flagship model: GPT-4 for OpenAI, Claude 2 for Anthropic, PaLM 2 for Google, Llama 2 for Meta, Titan Text for Amazon, and five more.1 Meta scored highest, with 54 out of 100. Amazon scored lowest, with 12. The mean was 37.1 The ceiling was not the problem. For 82 of the 100 indicators, at least one developer already disclosed the information, so every missing point was something a competitor had shown could be shared.1
The total hides the more useful part. The 100 indicators are grouped by where in the system the information lives: the resources that go into building a model, the model itself, and how the model gets used after release. Sorted that way, the index works as a map of an AI system, with a measurement on every region showing how much of it the builders let you see. This post walks the map one layer at a time. For each layer it gives what the index measured, and then what the 2021 paper that named foundation models says about how a problem at that layer travels to everything built above it.
Where the layers come from
In 2021 a Stanford group led by Rishi Bommasani introduced the term foundation model: a model trained on broad data, usually with self-supervision at scale, that can be adapted to a wide range of downstream tasks.2 They chose "foundation" on purpose. Such a model is incomplete on its own. It is the common base from which many task-specific models are built by adaptation, and the authors wrote that nobody could yet say whether that base was trustworthy.2
The same report describes the system around the model as a sequence of five stages. People create data. Data is curated into datasets. A model is trained on those datasets. The model is adapted into a working system, which the report says may involve many modules, custom rules on outputs, extra classifiers, and checks against other signals. Finally the system is deployed to people. Each stage can be run by a different organization.2
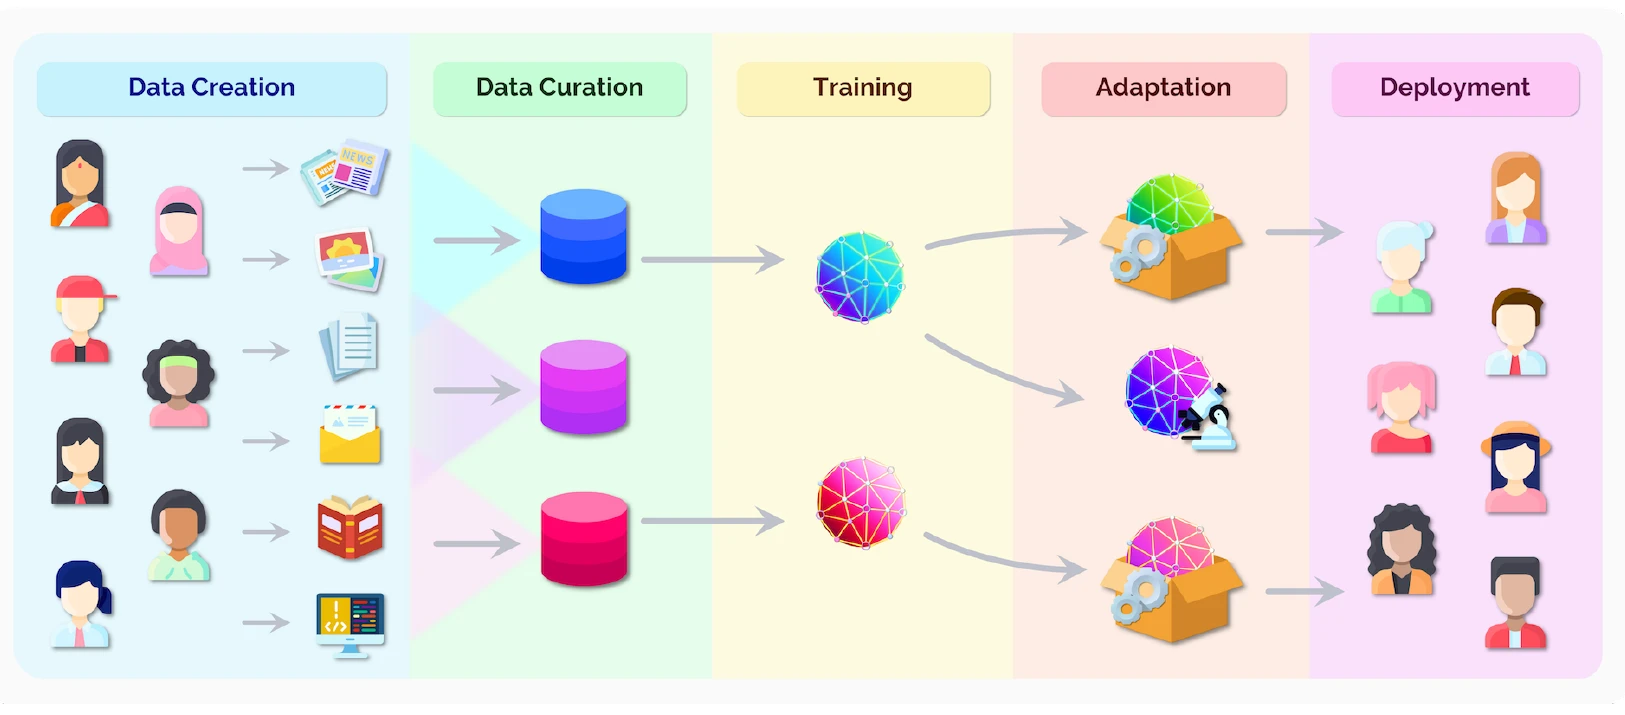
The transparency index folds those five stages into three domains.1 That split differs from a plain infrastructure, model and application picture in one useful way. Compute is not a floor of its own. It sits next to data and labor as one of several upstream inputs, which is also where the index found the least disclosure.1
- Upstream
- The resources used to build the model: data, the human labor that labels and filters it, compute, training methods, and code. 32 indicators in the 2023 index.1
- Model
- The model as a standalone artifact: its size and architecture, who can access it, its capabilities, limitations, risks, and the mitigations applied. 33 indicators.1
- Downstream
- What happens after release: distribution channels, usage policies, user data protection, feedback, and the impact on people, sectors and regions. 35 indicators.1
- Homogenization
- The 2021 report's word for many applications being built on the same few models. It gives leverage, since one improvement helps everything built on top, and it creates a single point of failure.2
Upstream: the ingredients nobody lists
The bottom layer scored worst. Developers averaged 7.2 of the 32 upstream indicators, or 22.5%, and the median was 3.5.1 Three companies, AI21 Labs, Inflection and Amazon, scored zero on every upstream indicator. Only Hugging Face cleared half, with 21.1 Broken down further, developers averaged 20% on data, 17% on data labor and 17% on compute.1
Some upstream questions got no points from anyone. No company disclosed who created its training data, what the copyright and license status of that data was, or what it did about copyright.1 Data labor, meaning the people who write, rank and filter the examples a model learns from, was close to a blank. Apart from BLOOMZ, which relied on volunteers, developers said nothing about how many such workers they used, who employed them, what they were paid, or what instructions they were given.1 On compute, Meta and Stability AI documented hardware, energy use and carbon footprint, and most others disclosed little or nothing.1
This matters for everything above it because of how training data shapes behavior. The 2021 report argues that models trained on similar data are likely to pick up similar biases and errors. Its example is ImageNet: models trained on it often lean on the same shortcuts, such as using a green grass background to predict that a picture shows a cow.2 The report calls for research into whether shared training data homogenizes a foundation model's correlations and whether that causes uniform failures in the models adapted from it.2 A team that builds on a foundation model inherits whatever its data taught. The index shows that team usually cannot find out what that data was.
Compute is where the economics of the bottom layer bite. Jai Vipra and Anton Korinek, in a 2023 Brookings working paper, argue that the market for the most capable models tends toward natural monopoly. Training carries high fixed costs, while deploying a trained model costs little per use, and they conclude that computational power is currently a significant barrier to entry.3 They also document vertical integration with compute providers. Google trained PaLM on its own chips, and Microsoft's investment in OpenAI made Microsoft its exclusive cloud provider for both training and serving.3 Stanford's AI Index puts rough numbers on the barrier: an estimated $78 million of compute to train GPT-4 and $191 million for Gemini Ultra. In 2023 industry produced 51 notable machine learning models against 15 from academia.4
The model: strengths published, weaknesses thinner
The middle layer did better on average. Developers met 14.1 of 33 model indicators (42.7%), and the median was 12.5.1 The authors point out that part of this comes from generous indicators, such as stating the input and output modalities.1 Even so, 8 of the 10 developers did not disclose the size of their model.1
The sharper finding is an asymmetry. Developers averaged 62% on capabilities and 60% on limitations, but only 24% on risks and 26% on mitigations.1 Eight developers demonstrated their model's capabilities, and the paper's summary finding says just two demonstrated its limitations. None evaluated several deliberate harms the model could be used for, and none gave reproducible or third-party evaluations of whether their mitigations worked.1 The authors warn that the gap could lead people to trust these models more than the evidence supports.1
This is the layer where homogenization bites hardest. The 2021 report describes a trade: homogenization "provides powerful leverage but demands caution, as the defects of the foundation model are inherited by all the adapted models downstream."2 It adds that foundation model behavior is implicitly induced rather than explicitly constructed, which it calls emergence, and that this makes the models hard to understand and prone to unexpected failure modes. Hence its line that "aggressive homogenization through these models is risky business."2 Put that next to the index scores and the problem is clear. The layer everything inherits from is the one where builders say least about how it fails.
Downstream: no one counts the impact
The top layer had the highest domain average, 15.7 of 35 indicators (44.9%), with nine of the ten developers between 14 and 21 points. OpenAI scored highest here, with 21.1 Distribution did well: every developer named its distribution channels and published terms of service, and the subdomain averaged 59%.1
Impact did worst, at 11%, the lowest subdomain in the whole index. No developer disclosed which market sectors its model affects, how many people it affects, usage reports, geographic statistics, or a way for affected people to seek redress.1 In the paper's words, there is "essentially no information about how many people, sectors, and regions foundation models are impacting."1 The 2024 follow-up gives part of the reason. Developers generally do not know how their model is used unless a deployer monitors use or passes on information from its customers.5
This is the layer where the 2021 report locates harm and one of its remedies. It notes that a model able to produce toxic content might still be tolerable if the right precautions are taken downstream, and treats the application-specific logic added during adaptation as a real safeguard.2 It also describes the opposite risk. If many automated decisions run on adaptations of the same model, the people being judged may face a more uniform set of judgments. The report borrows the term algorithmic monoculture for this, and warns it could lead to consistent and arbitrary rejection or misclassification of individuals.2 Vipra and Korinek raise the market version of that worry. Model producers can extend their power into downstream products, as with Microsoft's $30 per user per month Copilot for Office, which they note can be read either as a product improvement or as vertical integration. They add that systemic risk grows when one model or a small set of models is deployed across much of the economy.3
Six months later, most layers moved
The team ran the index again in May 2024 on 14 developers, using the same 100 indicators. This time developers submitted reports instead of the researchers searching only public sources.5 The mean rose from 37 to 58. The top score was 85, for BigCode, Hugging Face and ServiceNow's StarCoder, and the bottom was 33, for Adept's Fuyu-8B.5 Every one of the eight developers scored in both rounds improved, by 19 points on average. AI21 Labs gained 50 points and OpenAI gained 1.5 Much of the rise came from the process itself: on average, each developer disclosed information on 16.6 indicators that had not been public before.5
Upstream was still the least transparent layer, at 46%, against 61% for the model and 65% downstream.5 Inside it the picture was mixed. Compute disclosure rose from 17% to 51%, with companies sharing new figures on compute used, energy, hardware and carbon.5 Data access went the other way, falling from 20% to 7%, which the authors link to the legal risk of admitting what training data contains.5 Only one developer scored on data creators, copyright status, license status and personal information in data.5 Impact stayed the worst major subdomain, and four impact indicators still got no points from anyone.5
So the stack's shape held. The bottom layer is still where the ingredients go unlisted and the top layer is still where no one counts the effects. The 2021 report's claim about the stack is that defects flow downstream from the base. The index shows that the base is where outsiders can check the least.
What a transparency score does not measure
The index authors state its biggest limitation plainly: a transparency score is not a responsibility score. Points go to a developer for disclosing something, not for doing it well. Their example is data labor wages. A developer that discloses it pays data workers one cent an hour would earn the point on the wages indicator. A developer that pays $20 an hour but does not publish it would not.1 They also note that they scored generously, often rounding half-points up and giving the benefit of the doubt in grey areas, so some scores may be higher than the documentation warrants.1 The 2024 round adds one more caveat. It counts only public disclosure, and it leaves out information shared privately with governments or with downstream customers.5 A score of 85 tells you how much you can read about a model. It does not tell you whether what you read is good.
Sources
- Bommasani, Klyman, Longpre, Kapoor, Maslej, Xiong, Zhang, Liang. The Foundation Model Transparency Index. arXiv:2310.12941, 2023.
- Bommasani et al. On the Opportunities and Risks of Foundation Models. arXiv:2108.07258, 2021.
- Vipra and Korinek. Market Concentration Implications of Foundation Models: The Invisible Hand of ChatGPT. Brookings Center on Regulation and Markets Working Paper 9, 2023. arXiv:2311.01550.
- Maslej et al. The AI Index 2024 Annual Report. Stanford Institute for Human-Centered AI, 2024 (report).
- Bommasani, Klyman, Kapoor, Longpre, Xiong, Maslej, Liang. The 2024 Foundation Model Transparency Index. Transactions on Machine Learning Research, 2024. arXiv:2407.12929.