Shannon's guessing game and the loss language models minimize
Barakaeli Lawuo, May 6, 2026
In 1951 Claude Shannon published a short paper in the Bell System Technical Journal built around a guessing game. A person was shown a passage of English they had not seen and asked to guess its first letter. If the guess was right, they were told so and moved on; if it was wrong, they were told the correct letter. Spaces counted as a 27th letter.1 In one run on a passage that began "THE ROOM WAS NOT VERY LIGHT", the subject got 89 of 129 letters right on the first try, 69%. The misses bunched at the starts of words and syllables, where, in Shannon's words, "the line of thought has more possibility of branching out."1
A second version let the subject keep guessing until they hit the right letter, and Shannon recorded how many tries each letter took. On a 102-symbol passage, 79 letters came on the first guess, 8 on the second, 3 on the third, 2 each on the fourth and fifth, and only 8 needed more than five.1 From experiments like these he estimated that ordinary literary English carries somewhere between about 0.6 and 1.3 bits of information per letter once a subject knows the previous 100 letters, "something of the order of one bit per letter" with a redundancy of roughly 75%.1 With no knowledge at all, a 27-symbol alphabet needs , about 4.76 bits per symbol, the figure Shannon lists for zero context,1 so people were squeezing out most of the uncertainty with what they already knew about the language.
Change the guesser to a neural network and the question is still Shannon's: how many bits does it take to say what comes next? The number that answers it is cross-entropy, and it is the loss that language models are trained to push down.4 This post builds that number from Shannon's definitions.
A hundred passages from a Jefferson biography
The headline estimate came from a more careful experiment. Shannon picked 100 passages at random from a book, Dumas Malone's "Jefferson the Virginian", each 15 letters long. The subject guessed each passage letter by letter, which produced data for every amount of known context from 0 to 14 preceding letters. A similar test used passages where 100 letters were already known. The subject was allowed to use letter, digram and trigram frequency tables, a list of common words and a dictionary.1
The trick that turned guesses into entropy is what Shannon called the reduced text. Replace each letter with the number of the guess that found it, so "THERE IS NO REVERSE" becomes a string of mostly 1s. That string holds the same information as the original, because an identical predictor could rebuild the text from it by guessing the same way and stopping at the recorded try.1 The reduced text is easy to measure, since its statistics are mostly "1 is very common". Shannon proved an upper and a lower bound on the entropy of the original text in terms of how often each guess number appears.1
The first two columns of his table were not guessed by people. They were computed from published letter and digram frequencies, which is how a perfect predictor with no context, or with one letter of context, would rank its guesses.1 Everything after that came from a human.
Entropy, one symbol at a time
Shannon had defined the quantity three years earlier, in "A Mathematical Theory of Communication". For a source that picks one of symbols with probabilities , he wrote:2
- The probability that the next symbol is symbol . All the add up to 1.
- The information in seeing symbol , in bits. A symbol with probability 1/2 carries 1 bit and one with probability 1/8 carries 3. Rare symbols carry more.
- The sum weighted by
- An average. Entropy is the information per symbol you should expect, weighting each symbol by how often it actually shows up.
- Bit
- The unit when the logarithm is base 2. Shannon credits the word to J. W. Tukey; a relay or flip-flop with two stable positions stores one.2
Two properties make it a sensible measure of uncertainty. is zero only when one symbol has probability 1, so you are certain of the outcome. And for a fixed number of symbols, is largest, equal to , when every symbol is equally likely.2 Shannon also showed that any measure meeting three simple conditions has to take this form, though he said the real justification lies in what the definition lets you prove.2
The result it lets you prove is about coding. Shannon's fundamental theorem for a noiseless channel, stated in terms of channel capacity, implies that a source with entropy bits per symbol can be encoded to use, on average, as close to binary digits per symbol as you like, and no fewer.2 His own example is a source that emits A, B, C and D with probabilities 1/2, 1/4, 1/8 and 1/8. Its entropy is 7/4 bits per symbol, and the code A = 0, B = 10, C = 110, D = 111 reaches that exactly: on average binary digits per symbol.2 Each code length is for its symbol. That is the pattern to keep in mind: a good code spends bits on an event of probability .
Cross-entropy: the price of a wrong code
Now suppose you do not know the true probabilities. You have a model that assigns its own probabilities, and you build your code from those. Real text arrives according to the true distribution , but every symbol costs you bits. The average cost is the cross-entropy. Brown and colleagues at IBM, estimating the entropy of English in 1992, wrote it for text as:3
Read it from the inside out. is the probability the model gives to the character that actually comes next, given everything before it. The minus log turns that into bits of surprise. The expectation averages over text drawn from the real process, not from the model. In practice you cannot compute that average exactly, so you take a long test sample of characters and compute , which converges to the cross-entropy for a well-behaved source.3
The fact that makes this useful: for any model, .3 No model can beat the true entropy, so every model's cross-entropy on real text is an upper bound on the entropy of that text. That is how Brown's group got their estimate. A word trigram model trained on 583 million words scored 1.75 bits per character on the 5.96 million character Brown Corpus, over the 95 printable ASCII characters.3 They add one warning: the model must be built without seeing the test sample. A model that assigns probability 1 to the test text would score zero and prove nothing.3
A worked example makes the gap concrete. The numbers below are illustrative, built on Shannon's A/B/C/D source. The true probabilities stay at 1/2, 1/4, 1/8, 1/8, with entropy 1.75 bits.
- A model that thinks all four letters are equally likely, 1/4 each, spends 2 bits on every symbol. Its cross-entropy is exactly 2 bits.
- A model with the probabilities backwards, 1/8, 1/8, 1/4, 1/2 for A, B, C, D, spends 3 bits on each A, which shows up half the time. Its cross-entropy is bits.
- A model that matches the source exactly spends 1.75 bits, the entropy itself, and that is as low as the number can go.
The wrong model's worst bill comes from the common symbol it thought was rare. Confident mistakes on frequent events are what cross-entropy punishes hardest, because grows without limit as goes to zero.
Perplexity puts the bits back in the exponent
Speech recognition work commonly measured task difficulty by perplexity instead.3 Brown and colleagues state the link plainly: the cross-entropy they report "is just the base two logarithm of the character perplexity" of the text with respect to the model.3 Going the other way:
Why bother? Because entropy of a uniform choice among options is , which Shannon listed as the maximum case.2 So a perplexity of means the model is, on average, as uncertain as if it were picking uniformly from options at each step. That reading is mine, derived from the two definitions, not a claim from either paper. In the toy example, the true source has perplexity , the uniform model 4, and the backwards model about 6.17. Brown's 1.75 bits per character works out to a character perplexity of about 3.36 (my arithmetic), against 95 printable characters the model could have picked from.
The base does not matter as long as you are consistent. Shannon notes that picking a logarithm base is just picking a unit: base 2 gives bits, base 10 gives decimal digits.2 If a loss is computed with the natural log, it comes out in nats, and the matching perplexity is raised to the loss. The model is the same; only the unit changed.
The gap between them
Subtract the two quantities and you get how much the model costs you beyond the unavoidable minimum. Brown and colleagues call the difference between and "a measure of the inaccuracy of the model ."3 Written per symbol for a simple source, the gap is:
This gap is zero only when the model matches the source, and it can never be negative, since for every model.3 In the toy example it is 0.25 bits for the uniform model and 0.875 for the backwards one. The name to watch for is KL divergence. It is not symmetric: swap and and you generally get a different number, because the average is always taken over whichever distribution sits first.
One naming trap. Shannon's 1948 paper also uses the phrase "relative entropy", but for something else: the ratio of a source's entropy to the maximum it could have with the same symbols. One minus that ratio is his redundancy, which he put at roughly 50% for English when only statistics over about eight letters are counted.2 Do not confuse it with the gap between cross-entropy and entropy above.
This split explains why training on cross-entropy makes sense even though we never learn the true entropy of text. is fixed by the data and the model cannot change it. So every step that lowers cross-entropy lowers the KL gap by the same amount, and the model moves closer to the real distribution.
Chinchilla as a file compressor
Shannon's coding theorem runs both ways, and in 2023 a Google DeepMind team, with Grégoire Delétang and Anian Ruoss as joint first authors, took it literally. Their point: the expected length of an optimal code equals the negative log2 likelihood under the model, so the cross-entropy that language models minimize is "exactly the same objective" as the length of the file you would get by compressing with that model. Current training, they write, uses a "maximum-compression objective."4
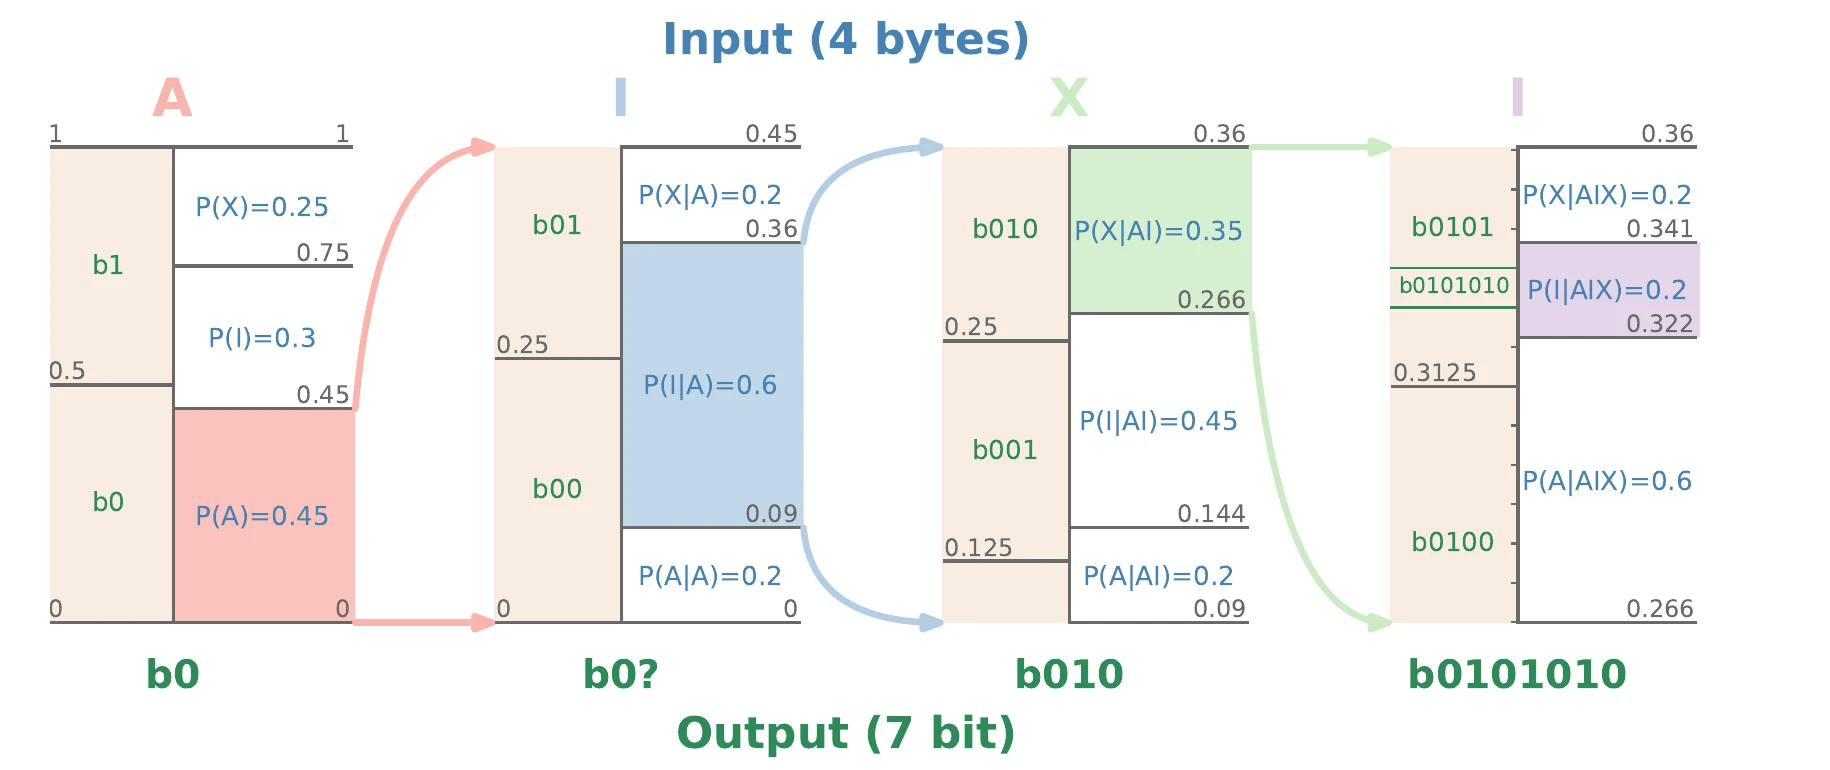
The bridge from probabilities to an actual file is arithmetic coding. The coder keeps an interval inside [0, 1) and, for each symbol, shrinks it to the slice the model assigns to that symbol. Likely symbols shrink it a little and cost few bits; unlikely ones shrink it a lot.4 With infinite precision it needs about bits, against an optimum of .4
They then ran real models as compressors on 1 GB each of three kinds of data: enwik9 (Wikipedia text), grayscale ImageNet patches, and LibriSpeech audio. Because the Transformers can only see 2,048 tokens at once, every dataset was cut into 2,048-byte chunks and compressed chunk by chunk; the classical compressors were run both on chunks and on the whole file.4
Chinchilla 70B, trained mostly on internet text and books, compressed the image patches to 48.0% and the audio to 21.0% of their raw size in this setup. The paper's abstract compares the image result to PNG at 58.5% and the audio result to FLAC at 30.3%.4 The abstract gives Chinchilla figures of 43.4% and 16.4%, lower than the 48.0% and 21.0% in Table 1 of the same version; the chart uses the table. Either way, a text model beat the format built for the job. The authors attribute this to in-context learning: the model adapts to the data inside its context window, without any gradient update.4
On text the gap is wide. Chinchilla 70B brought enwik9 to 8.3% of its size. gzip reached 48.1% on the same chunks and 32.3% on the unchunked file, where it can use its full 32 kilobyte window.4 Brown's 1992 comparison had the same shape at a smaller scale. On the Brown Corpus, a Huffman code over characters reached 4.46 bits per character, UNIX compress 4.43, an adaptive Lempel-Ziv scheme 4.20, and the trigram model 1.75.3 A better predictor means a smaller file, which is the same statement as a lower cross-entropy.
What the estimates cannot tell you
Delétang's own table has a column that sinks the headline results. Their adjusted compression rate counts the model's parameters, stored at 2 bytes each, as part of the compressed output. On that basis Chinchilla 70B does not compress enwik9 to 8.3%. It expands it to 14,008.3%, because the weights (140 GB at 2 bytes per parameter, by my arithmetic) cannot be paid off by compressing 1 GB of data.4 They estimate that a foundation model reaches useful adjusted rates only on datasets on the order of terabytes, and with small Transformers trained on enwik8 they show that each dataset size has a model size past which a bigger model makes the adjusted rate worse again.4 Cross-entropy measured on test text says nothing about the cost of the model that produced it.
Shannon was just as frank about his numbers. Treating a subject's observed guess frequencies as true probabilities left "considerable sampling error" in the table. The lower bound was proved only for an ideal predictor, and his frequencies came from a human. He added that some rough calculations indicated the shortfall of the ideal lower bound more than makes up for the human failing to predict ideally, and so he felt "reasonably confident of both bounds apart from sampling errors."1 He also warned that the figures depend on the text: newspaper writing, scientific work and poetry gave somewhat poorer scores than ordinary literary English, and as the stretch of context grows, the estimates "depend more critically on the type of text involved."1
Brown and colleagues named the opposite weakness in machine estimates. Their 1.75 bits was higher than earlier human-based estimates, and they judged it more reliable statistically because it rested on millions of characters instead of a few hundred letters. They still wrote that "it is probable that people predict English text better than the simple model that we have employed here."3 So a cross-entropy number is always a statement about one model, on one kind of text, in one unit, and the true entropy it bounds sits somewhere below it.
Sources
- Shannon, Prediction and Entropy of Printed English, Bell System Technical Journal 30(1), 1951
- Shannon, A Mathematical Theory of Communication, Bell System Technical Journal 27, 1948
- Brown, Della Pietra, Della Pietra, Lai, and Mercer, An Estimate of an Upper Bound for the Entropy of English, Computational Linguistics 18(1), 1992
- Delétang, Ruoss, et al., Language Modeling Is Compression, ICLR 2024
- Kullback and Leibler, On Information and Sufficiency, Annals of Mathematical Statistics 22(1), 1951